The UV Spectrum of the HHOs
The UV spectrum of the HHOs consists of a continuum which rises towards short wavelengths and some emission lines (typically of C IV, Si III], C III], C II] and Mg II as well as of molecular hydrogen).
Lines
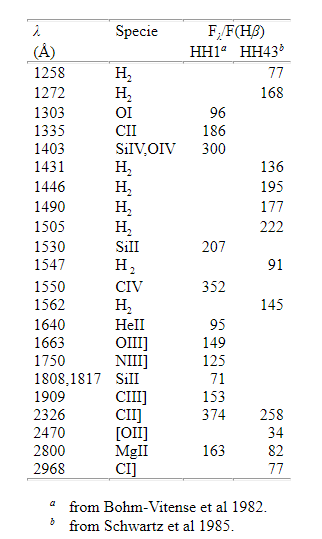
The lines observed in the UV spectra of the HHOs depend on the degree of excitation of the nebulosity. High excitation objects like HH1 or HH2 produce strong emission lines of CIV (UV1), OIII](1663), SiIII](1892) and CIII](1909) in the short wavelength range (1200-2000 Å) (Ortolani & D’Odorico 1980, Bohm et al 1981, Brugel et al 1982, Bohm-Vitense et al 1982). However, low excitation objects like HH43 or HH47 are characterized by the presence of the H2 Lyman band emission lines (Schwartz, 1983, Schwartz et al 1985). In the long wavelength range (2000-3200 Å) lines of CII](2326), [OII](2470) and MgII (UV1) are observed in both types of objects (Bohm et al 1981, Bohm-Vitense et al 1982, Schwartz et al 1985, Cameron & Liseau 1990). The strength of these lines relative to Hβ is indicated in Table 1 for two prototypical objects: HH1 and HH43
Table 1: UV lines observed in HHOs
Emission lines have been detected with the IUE only for some few objects, namely, HH1 (Ortolani & D’Odorico 1980, Bohm et al 1981, Bohm-Vitense et al 1982), HH2 (Brugel et al 1982, Bohm-Vitense et al 1982), HH7 (Cameron & Liseau 1990), HH11 (Cameron & Liseau 1990), HH29 (Cameron & Liseau 1990), HH32 (Bohm & Bohm-Vitense 1984), HH43 (Schwartz 1983; Schwartz et al 1985) and HH47 (Schwartz 1983); only the MgII line was detected in HH7 and HH11. Therefore, the IUE sample reduces to 6 objects for line emission studies.
The lines are variable. Variability studies have been carried out for HH1 (Brugel et al 1985, Bohm et al 1993), HH2 (Bohm et al 1993) and HH29 (Cameron & Liseau 1990, Liseau et al 1996).
The spatial structure of the line emission region was resolved with the IUE for some few objects. Detailed studies on this structure can be found for HH1 and HH2 (Bohm-Vitense et al 1982, Bohm et al 1987, Lee et al 1988, Bohm et al 1993, Moro-Martín et al 1996), HH32 (Lee et al 1988, Moro-Martín et al 1996) and HH43 and HH 47 (Bohm et al 1991).
Continuum
The UV continuum of the HHOs is strong. As an example, the luminosity radiated by HH1 in the UV continuum is ~ 76 % of the solar luminosity and about a factor of 14 higher than the energy emitted within the (3200-11000 Å) spectral range (Bohm et al 1981).
The UV continuum rises steeply towards short wavelengths, at least down to 1300 Å. The continuum has a detailed structure with some peaks between 1300 Å and 1800 Å and with a quite steep maximum at 1580 Å (Schwartz 1983, Bohm et al 1987, Bohm et al 1991). The overall spectral energy distribution is similar in high excitation objects like HH1 or HH2 and in low excitation objects like HH43 and HH47 (Schwartz 1983, Bohm et al 1987, Bohm et al 1993). The qualitative behaviour of the continuum seems to be quite insensitive to different types of extinction curves although a curve without the 2200Å feature seems to be the best approximation applicable, at least to HH1 and HH2 (Bohm-Vitense et al 1982). By the late 80’s consensus was reached in that the θ-Ori curve provides the best correction (Schwartz et al 1985, Bohm et al 1987). However, the uncertainties in the interestellar reddening law to be applied are still large and difficult the determination of the emission mechanism.
The continuum is variable. Detailed studies of the continuum variability are only available for HH 29. A long term monitoring between 1986 and 1994 showed that the variations of UV continuum in the 1300-1900 Å range are correlated with the variations of the high ionization species, whereas the variations from low-ionization species appear anticorrelated (Liseau et al 1996).
The spatial distribution of the UV continuum was first studied by Lee et al (1988) and compared with the optical data for HH1, HH2, HH24, HH43 and HH47. They found that the UV continuum distribution in the long wavelength range (2000-3200 Å) is quite narrow and comparable to the optical while in the short wavelength range (1300-1950 Å) is broader than any emission line (UV or optical). Further studies for these objects were carried out by Bohm et al (1993) and Moro-Martín et al (1996).
|